







Overview
PREMIUM PV POWER FORECAST MODEL
Our most comprehensive PV forecast, trained on your production data
.png)
Introduction
This page explains how the Premium PV Power Forecast Model works, what data it uses, and what the API returns. Premium PV is a site-trained, probabilistic power forecast for operating PV power plants, delivered through the Solcast API with global coverage from now to 14 days ahead.
Premium PV is managed by DNV. We quality-control your measurement data, configure and run the training, review the result before it goes live, and retrain the model periodically to capture ongoing improvements. The same Solcast API then serves the trained forecast.
1. Model overview
The Solcast Premium PV Power Forecast Model forecasts power for operational solar projects. It is designed for operators whose forecast accuracy affects penalties, imbalance settlement, day-ahead bidding or dispatch coordination.
The effectiveness of Premium PV is maximised when enough production history is available to train the model. For a new PV power plant, DNV can initially configure a physics-based forecast from the plant specifications, then train the full Premium PV model once enough production data has accumulated.
The Solcast Advanced PV model estimates plant behaviour from configured specifications, Premium PV also learns from measured generation history. This allows the model to reflect site-specific behaviour, including observed clipping and shading effects, that may not be fully represented by the plant specifications alone.
Learn more about differences between Premium and Advanced PV models here.
Each Premium asset is identified by a unique resource ID. DNV creates your assets in the Solcast API as part of onboarding and provides the resource ID for each one. Forecasts are then retrieved by making a request to the Solcast API with that resource ID.
DNV makes the forecast available after training has been completed and reviewed.
2. Input data and model chain
Premium PV combines three classes of input: your plant's production history, Solcast's satellite-derived irradiance and weather data, and a site-specific weather ensemble built from multiple numerical weather prediction (NWP) sources.
- Solcast data inputs. The model uses Solcast's irradiance parameters (GHI, DNI, DHI and GTI) together with satellite cloud tracking and forecasting, ambient parameters including air temperature and wind speed, satellite-derived albedo, and a dynamic site-specific snow-soiling loss derived from irradiance, temperature and precipitation. PM2.5 and PM10 particulate concentration data is available through the API to support soiling analysis.
- Weather ensemble. Rather than depending on a single weather model, Premium ingests a wide range of global and regional NWP sources, downscales them to your site, and applies statistical bias correction against your site's own record. Using many sources reduces sensitivity to the biases of any one of them.
- Model chain. DNV fits multiple model types to your site’s production history and selects the best-performing approach based on measured performance. The model represents forecast uncertainty through P-levels, which correspond to specified probabilities of exceedance. A DNV forecasting specialist reviews the training results before the model goes live.
.png)
3. Training on your production data
- What we need. One year of recent generation history is recommended to capture seasonal changes in plant performance. Shorter records can be used, but may not achieve the same forecast accuracy. For a new plant, or where insufficient production data is available, DNV can initially run a physics-based forecast from the plant specifications and train the full Premium PV model once more data has accumulated. Historical data provided for training should be at hourly resolution or better.
- What "trained" means. Premium PV is trained on your plant’s generation history, matched against the weather conditions at the site. That lets the forecast reflect site-specific behaviour such as clipping, shading, curtailment patterns and seasonal soiling, rather than relying only on plant specifications.
- Model maintenance. DNV reviews and updates trained models as modelling improvements become available. Tell DNV about material changes to the plant, including repowering, capacity changes or major equipment replacement, so that the model configuration can be reviewed.
- Curtailment in training data. If curtailment or outages are present in the historical data, they need to be marked separately from normal generation. Otherwise, the model may treat reduced output as normal site performance. The measurement template includes availability, curtailment and power fields so these periods can be identified during training. If availability and curtailment cannot be separated in your data, let us know during onboarding.
4. Probabilistic outputs and how to read them
Alongside the central forecast, the Max plan returns values at P90, P75, P25 and P10.
Premium PV uses the probability-of-exceedance convention:
- P90 is the level that generation has a 90% probability of exceeding. It is the lower, more conservative estimate.
- P10 is the level that generation has a 10% probability of exceeding. It is the higher, less conservative estimate.
Therefore, Premium PV’s P90 value is lower than its P10 value. We state the convention explicitly because P-level labels can be confused with percentiles which have the opposite order.
Note for Advanced PV : Advanced PV’s pv_power_advanced10 and pv_power_advanced90 are high and low cloudiness scenario values, respectively, rather than probability-of-exceedance values, and their numbering follows the opposite ordering.
5. Data handling
- What we use your data for. We use your measurement and plant data to produce forecasts for your sites, train your site models and analyse forecast performance. Access is limited to authorised DNV personnel who need the data to support and improve your service.
- Where your data is stored and processed. Unless different data-residency terms are agreed in your contract, customer data is stored and processed in Sydney, Australia. DNV uses Amazon Web Services in the ap-southeast-2 region to store and back up the data securely.
- How your data is protected. Customer data is isolated from other customers’ data using physical and logical controls, including access controls, permission boundaries and separation between customer environments. Access is restricted to the customer’s authorised users and the DNV personnel required to support the service.
- Data retention. Customer data is retained for the contract duration or for a maximum of five years, unless different terms are agreed in your contract or required under applicable DNV policies. For detailed retention requirements, DNV can refer specific questions to the appropriate QHSSE team.
- Regional arrangements. Where agreed in the contract, DNV can support analysis in a specified country or region. Commercial arrangements, availability and pricing for regional storage or processing are confirmed as part of the product and contract process.
6. Specifications
Plans
Specification | Starter | Pro | Max |
|---|---|---|---|
Updates per location | Every 6 hours | Every 15 minutes | Every 5 minutes |
Time coverage | Now to +14 days | Now to +14 days | Now to +14 days |
Temporal resolution | 30, 60 minutes | 15, 20, 30, 60 minutes | 5, 10, 15, 20, 30, 60 minutes |
Geographic coverage | Global | Global | Global |
Output | Single point | Single point | Single point |
Power model | Premium PV, pre-configured by DNV | Premium PV; curtailment and outage scheduling | Premium PV; curtailment and outage scheduling; probabilistic scenarios |
Model training and review | Included | Included | Included |
Real-time measurement input | No | No | Optional |
Product Specifications
Geographic coverage
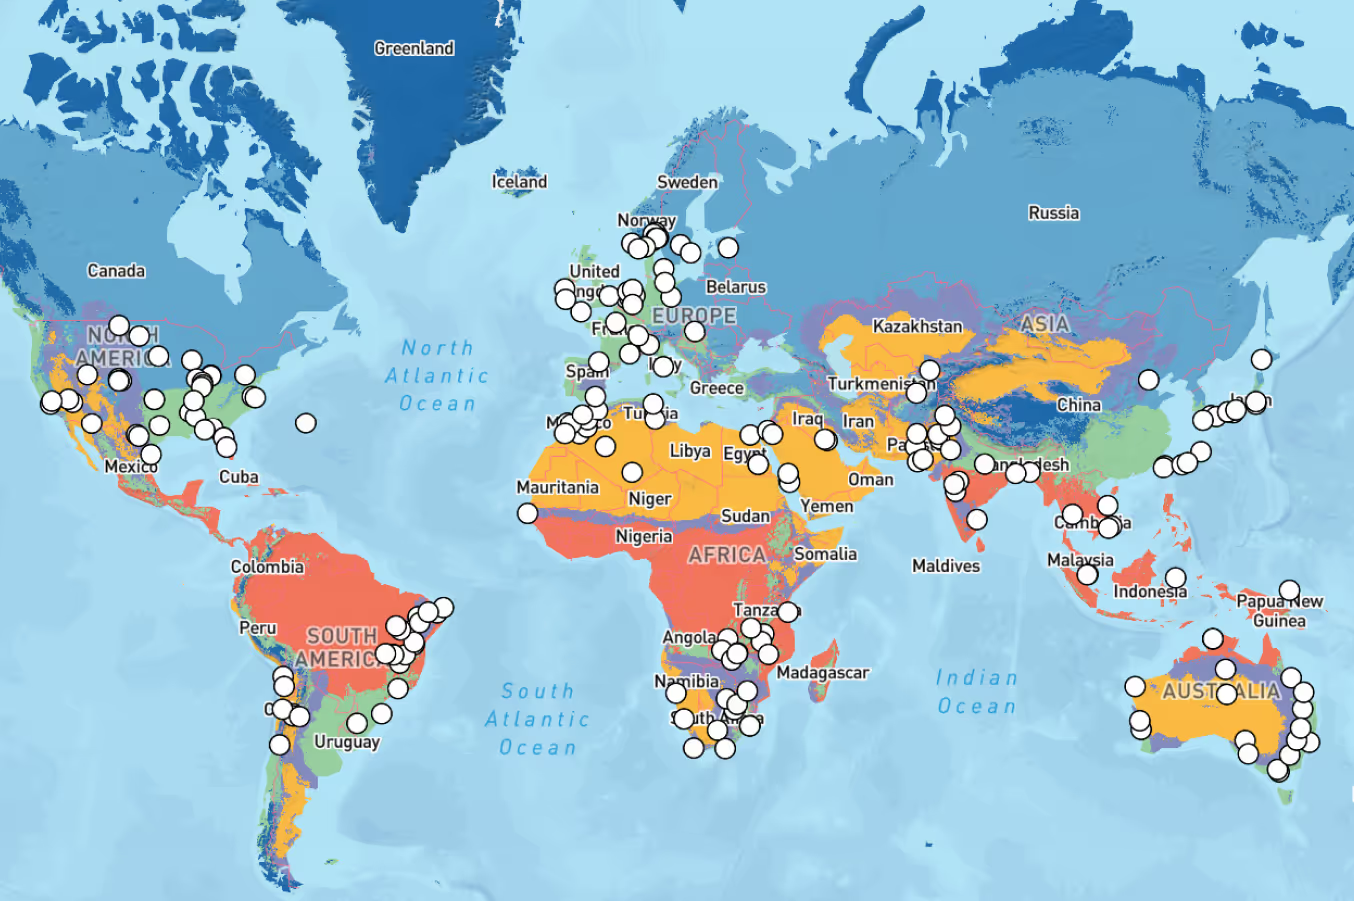
Global (note: far ocean and polar regions are coarser resolution)
Temporal coverage
Now to +14 days
Temporal resolution
5, 10, 15, 20, 30 & 60 minutes (period-mean values), subject to plan
Spatial resolution
90m (irradiance, PV power, snow soiling and cloud parameters, over all non-polar continental areas and nearby islands)
3-27km (other parameters, and polar or remote oceanic regions)
Data parameters
The following data parameters are available.
+
Power Parameters
- Power (MW) - Starter, Pro, Max
- Curtailed Power (MW) - Pro, Max
- Availability (%) - Pro, Max
- Curtailment (MW) - Pro, Max
- Probabilistic values: P90, P75, P25, P10 (MW) - Max
+
Irradiance Parameters
- Global Horizontal Irradiance*^ (GHI) (W/m2)
- Direct Normal Irradiance*^ (DNI) (W/m2)
- Diffuse Horizontal Irradiance*^ (DHI) (W/m2)
- Global Tilted Irradiance*^ (GTI) (W/m2)
^Clear-sky values also available
*Probabilistic scenarios available (P10, P90)
**Probabilistic scenarios available (P10, P25, P75, P90)
+
Solar Parameters
- Cloud Opacity (%)
- Air Temperature (°C)
- Solar Zenith Angle (°)
- Solar Azimuth Angle (°)
- Albedo (%)
- Snow Soiling Loss - Ground Mounted (%)
+
Weather Parameters
- Air Temperature (period, daily min/max) (°C)
- Wind Gust (m/s)
- Wind Speed (10 & 100m) (m/s)
- Wind Direction (10 & 100m) (°)
- Relative Humidity (%)
- Surface Pressure (hPa)
- Precipitable Water (kg/m²)
- PM2.5 (μg/m³)
- PM10 (μg/m³)
- Precipitation Rate (mm/h)
- Dewpoint Temperature (°C)
- Snow Depth Water Equivalent (cm)
- Snow Depth (cm)
- Snowfall Rate (cm/h)
- Thunderstorm Potential – CAPE (J/kg)
- Weather (string)
Data access
API or Web download
Download wait time
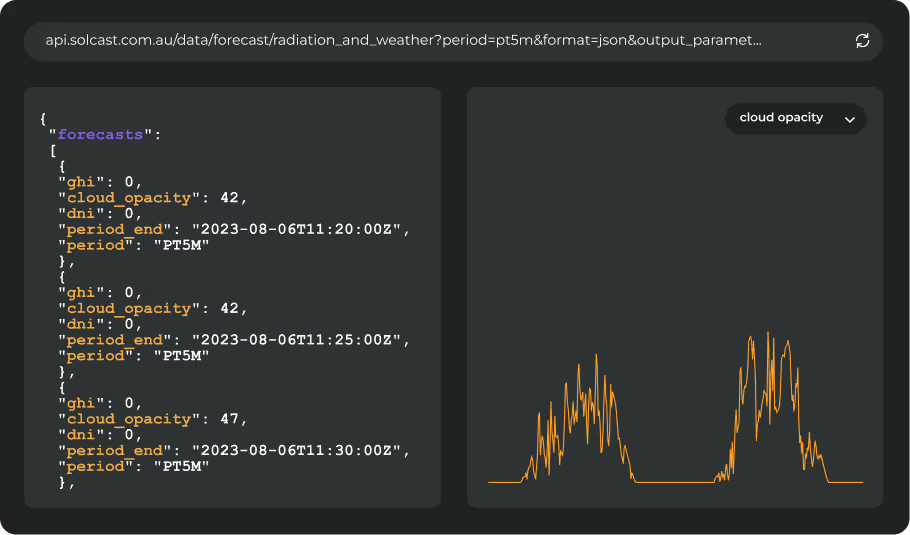
API: synchronous requests, typical response ~200ms
File formats
JSON, CSV and HTML
Data formats
Solcast
Time zone
UTC
7. Operating conditions: availability and curtailment
Premium PV can account for planned outages and curtailment when these limits are known ahead of time. Submit availability and curtailment schedules against the asset’s resource ID through the API or Web Toolkit. The API can then return both the unconstrained forecast and the constrained forecast, showing expected production before and after the submitted limits are applied.
Availability and curtailment scheduling are available on the Pro and Max plans.
8. Appendix A: asset specification parameters
The fields below describe the plant. Required fields must be supplied before the model can run. Optional fields can be left blank; where they are not supplied, the model uses estimated values. Supplying optional fields reduces the assumptions required by the physics-based forecast, particularly for a new plant while production data is accumulating.
Expand each section to view the parameter definitions and how each is used.
+
A1. Basic plant parameters (required)
Name | Definition | How we use this |
|---|---|---|
Name | The name you use for the site. Text. | Identifies the site in the Toolkit, measurement files and correspondence. Can be changed. |
Latitude | Site latitude at the centre of the plant, in decimal degrees (EPSG:4326*). | Locates the site and determines the relevant irradiance and weather data. |
Longitude | Site longitude at the centre of the plant, in decimal degrees (EPSG:4326*). | Locates the site and determines the relevant irradiance and weather data. |
Capacity | Total inverter (AC nameplate) capacity, in MW | Used to model the conversion of DC power to AC power through the plant’s inverters. |
DC Capacity | Total module capacity, in MW. Usually slightly higher than AC capacity. | Used to model DC power generation from the plant’s modules. |
Tracking Type | The geometrical configuration of your modules: fixed or horizontal_single_axis. | Used to calculate the irradiance incident on the modules. |
Installation Date | The date the plant was commissioned. YYYY-MM-DD. | Used to apply age-related degradation to modelled DC production. |
Grid Export Limit (Optional) | The maximum power, in MW, that the plant is permitted to export through its grid connection. | Applies a final cap to forecast AC output where the export limit is lower than the plant’s AC capacity. |
EPSG:4326 is the standard latitude-and-longitude coordinate system commonly used by GPS and web mapping services*
+
A2. Module and inverter parameters (optional)
Name | Definition | How we use this |
|---|---|---|
Module Temperature Derating | The factor by which DC production is derated as module temperature rises. Fraction per °C. | Used to reduce modelled DC production as module temperature rises. |
Module System Age Derating | The factor by which the system derates per year since the installation date. Fraction per year. | Used to reduce modelled production as the system ages. |
Other Derating Factors | System-wide losses from causes other than temperature and age, such as wiring, mismatch and availability of individual strings. Fraction. | Applied as a fixed loss in the conversion from irradiance to power. |
Inverter Peak Efficiency | The peak efficiency value on your inverter efficiency curve. Fraction. | Scales the modelled conversion of DC to AC power as a function of inverter load. |
Ground Coverage Ratio | The proportion of the site's ground area covered by modules. Fraction. | Used to calculate the irradiance incident on the modules and represent row-spacing effects. |
+
A3. Geometry parameters for fixed-tilt sites
Name | Definition | How we use this |
|---|---|---|
Azimuth | The off-north-facing direction on the horizon in which the modules are facing for a fixed-tilt site. Range is: -180 to 180. South is -180, East is -90, North is 0, West is 90 Degrees. | Used to calculate incident irradiance on your modules, and sets the expected shape of the generation day. |
Tilt | The off-horizontal tilt angle of the modules. Range is 0 to 90. Zero means the modules are horizontal Degrees. | Used to calculate incident irradiance on your modules, and drives seasonal generation shape.lled production as the system ages. |
+
A4. Geometry parameters for horizontal single-axis tracking sites
Name | Definition | How we use this |
|---|---|---|
Tracker Axis Azimuth | The off north-south azimuth angle of the tracker axis. Degrees. Most commonly close to zero. | Used to calculate incident irradiance across the tracking day. |
Tracker Max Rotation Angle | The maximum off-horizontal rotation the trackers reach. Degrees. | Bounds the modelled tracking range, which shapes early-morning and late-afternoon generation. |
Tracker Back Tracking | Whether the trackers back-track at low solar elevation to avoid row-to-row shading. Y/N. | Changes the modelled row-shading behaviour at the start and end of the day. |
Tracker Smart Tracking | Whether the trackers move to horizontal during cloudy periods with zero DNI. Y/N. | Changes modelled tracker position during overcast conditions, when diffuse irradiance dominates. |
+
A5. Terrain and soiling parameters (optional)
Name | Definition | How we use this |
|---|---|---|
Terrain Slope | The average terrain slope across the site. Degrees. A flat site is zero. | Used by the physics-based model to calculate irradiance incident on modules installed on sloping ground. |
Terrain Azimuth | The downhill direction of the average terrain slope, measured in degrees from north. | Used with terrain slope to represent the overall orientation of the site. Only relevant where terrain slope is greater than zero. |
Dust Soiling Average | The average proportion of production lost to dust soiling, supplied as one annual value or 12 monthly values. Fraction. | Used to reduce modelled DC production for dust soiling. Monthly values represent seasonal changes in soiling. |
Note on surrounding terrain: Premium PV uses high-resolution topographic data to account for shading from surrounding terrain. Therefore Premium PV and does not require the customer to provide a separate horizon profile.
+
A6. Bifacial parameters (optional)
Name | Definition | How we use this |
|---|---|---|
Bifacial System | Whether the plant uses bifacial modules. Y/N. | Used to calculate DC production from bifacial modules. |
Site Ground Albedo | The proportion of incident irradiance reflected by the ground beneath the modules. Fraction. | Used to calculate ground-reflected irradiance, particularly for bifacial systems. If no value is supplied, the model uses satellite-derived albedo. |
Bifaciality Factor | The efficiency of the rear of the module relative to the front under the same irradiance. Fraction. | Used to calculate production from the rear of bifacial modules. |
PV Row Height | The height of the module rows above the ground, measured to the centre or axis of the row. Metres. | Used to calculate rear-side irradiance and production for bifacial systems. |
PV Row Width | The width of the complete module row, measured perpendicular to the tracker axis. Metres. | Used to calculate rear-side irradiance and production for bifacial systems. |
9. Appendix B: training measurement fields
Supply your generation history in the format below. One row per interval, per asset.
Expand each section to view the parameter definitions and how each is used.
+
Training measurement parameters
Name | Definition | How we use this |
|---|---|---|
Name | The asset the record belongs to. Must match the asset name in Appendix A. | Routes each record to the right site model. |
Period End | The end of the measurement interval. ISO 8601 datetime including time zone. Required. | Aligns your generation record to our irradiance and weather record. Time-zone and interval-convention errors here are the most common reason a training run is sent back at quality control, so supply the time zone offset explicitly rather than assuming local time. |
Period | The length of the interval, as an ISO 8601 duration, for example PT15M. Required if Period Start is not supplied. | Defines the averaging window, so the measurement is compared against the matching weather interval. |
Period Start | The start of the measurement interval. ISO 8601 datetime. Required if Period is not supplied. | An alternative to Period. Supply one or the other. |
Power | Actual generation over the interval, in MW, including any impacts of availability and curtailment. Required. | The target the model learns to predict. This is the ground truth used for training, which is why it is quality-controlled before the model is trained. |
Availability | The proportion of plant capacity available over the interval, as a percentage. Optional. | Identifies intervals where the plant was partly or wholly unavailable, so reduced output is attributed to an outage rather than to weather. Omit from rows where availability is not restricted. |
Curtailment | The output ceiling applied over the interval, in MW. Optional. | Identifies intervals where output was deliberately limited, so the model is not taught that your plant is smaller than it is. Omit from rows where there is no curtailment. |
+
Example records
Name | Period End | Period | Period Start | Power (MW) | Availability (%) | Curtailment (MW) |
|---|---|---|---|---|---|---|
Example asset | 2026-03-01T06:15:00Z | PT15M | 2026-03-01T06:00:00Z | 78.24 | 100 | Curtailment equals the maximum AC capacity when the solar farm is operating without curtailment. |
Example asset | 2026-03-01T06:30:00Z | PT15M | 2026-03-01T06:00:00Z | 70 | 100 | 70 |
10. Appendix C: output data parameters
Expand each section to view the parameter definitions and how each is used.
+
Output data parameters
Name | Definition | How we use this |
|---|---|---|
power | Forecast AC generation for the interval, in MW. The central forecast. | Your primary forecast value: the central estimate of what the plant will generate. |
curtailed_power | Forecast AC generation, in MW, with any availability and curtailment that you have scheduled, applied. | What the plant is actually permitted to generate. Use this for scheduling and bid submission where constraints are in force. Pro and Max. |
availability | The availability figure applied to the interval, as supplied by you. | Shows the availability value applied to the forecast, making the submitted schedule visible in the response. Pro and Max. |
curtailment | The curtailment figure applied to the interval, as supplied by you. | Shows the curtailment ceiling applied to the forecast, making the submitted schedule visible in the response. Pro and Max. |
11. Appendix D: API request parameters
Benchmark Premium PV on your own generation data
The most useful benchmark is one run on your own site, using your own generation history