Forecast last issued: 2024-04-08 15:38 UTC
Sources: Eclipse data - NASA
Cloud Forecasts - Solcast API
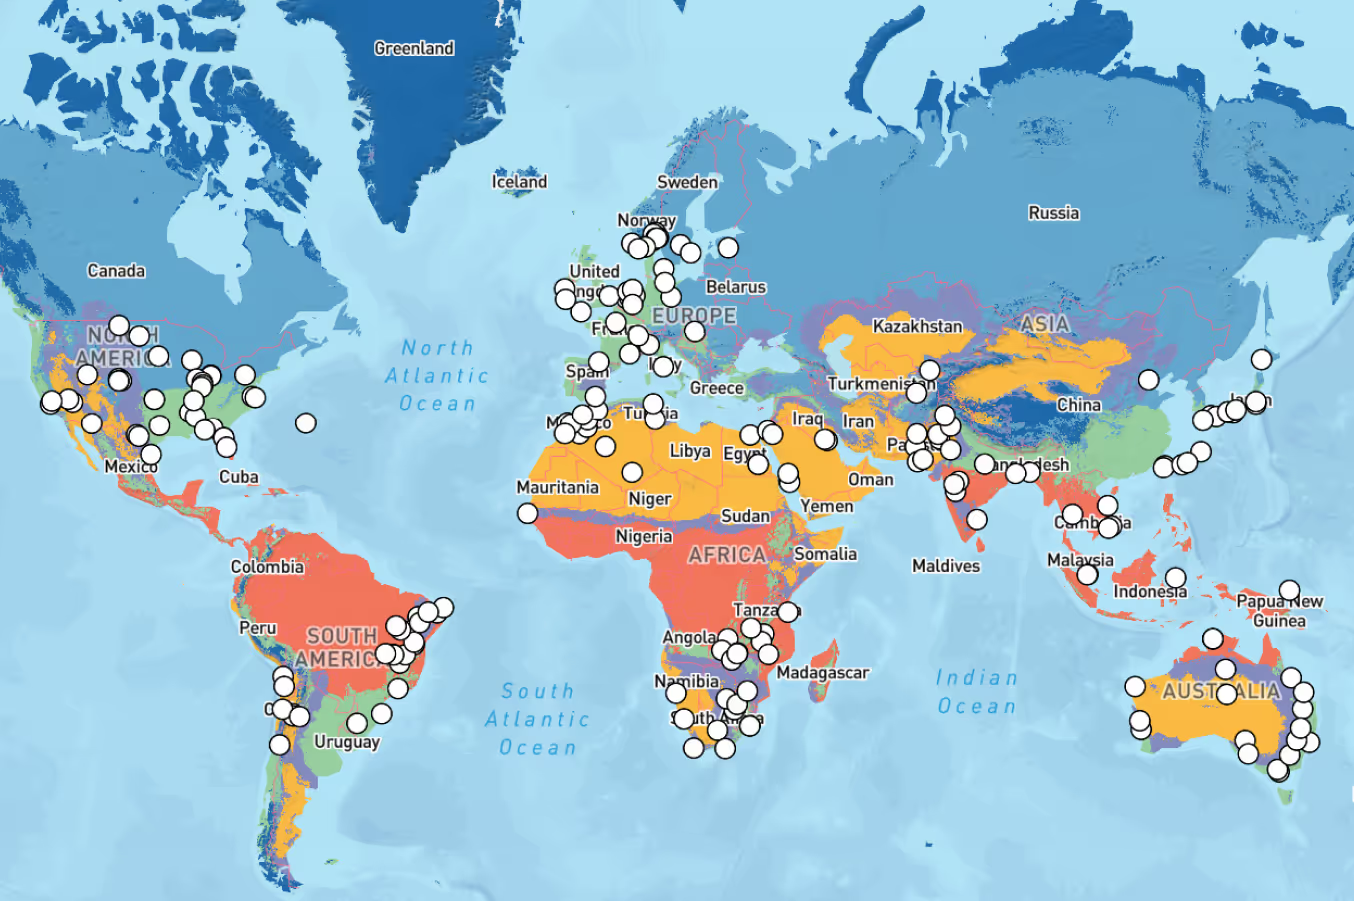
Solar Asset Locations and Capacity - U.S. Geological Survey
Monday's eclipse will be a big moment for both those watching the eclipse and for those managing solar assets and power grids. We'll be updating this forecast data all the way through to the eclipse, and forecasts get more accurate as the day approaches, so check back!
How do I use this map?
This map shows the current forecast for cloud thickness, as a percentage figure. Whilst the detail of this number matters a lot for solar generation, for those hoping to see the eclipse, locations with a cloud thickness over 20% will likely have an obstructed view of the eclipse. But remember this is a forecast, and we'll keep updating the data right up until the eclipse. Solcast's forecasts use satellite cloud tracking, so in the hours before the eclipse this map will show our most accurate forecasting, based on how the clouds are actually developing.
We have also added data from the U.S. Geological Survey on Solar sites in the US over 6MW AC Capacity, so if you're running solar projects you may be able to find your own assets here directly. Make sure you zoom in to see how solar projects around the country will be impacted! This forecast is an average thickness for the two hour period of the eclipse, instantaneous values will likely be higher or lower through the period of the eclipse, even if the average is spot on.
If you would like to understand how the eclipse, weather, aerosols and more impact irradiance for your solar assets, you can access Solcast historic actuals and forecasts through a Commercial Toolkit account. You can also request a quote to speak to one of our team about how your team can use Solcast Data!
Why does the forecast look smooth?
More than 5 hours ahead, the forecast looks smoother than our short range forecasts and real-time and historical actuals. That's because at that time range, there isn't enough data to track clouds reliably and where they might go, so we use a tuned ensemble forecast, combining the best available data from multiple models with our own models to produce advance forecasts. As we get closer to the eclipse, the forecast will start to get 'sharper' with more detail, as we start to use cloud tracking to predict where clouds will be during the eclipse. This forecast is also an average for each location for the two hour period that the eclipse will impact the continent. To get the absolute best, 5 minute forecast for clouds for your location, you can use a commercial account in the Solcast toolkit to make up to 10 forecasts requests at 5 minute resolution for free for any location.
What is Cloud Thickness?
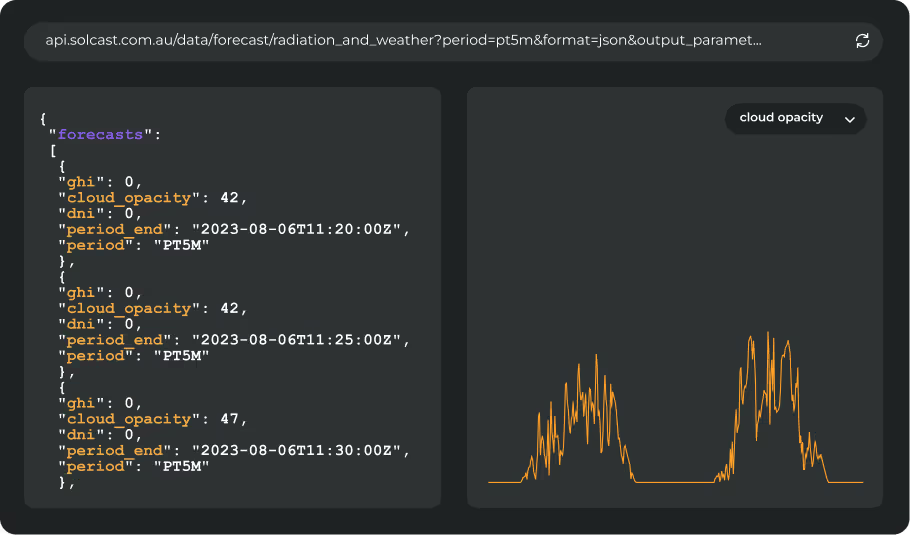
Technically this forecast is for cloud opacity, which measures the optical thickness of clouds and in solar applications is a measure of how much sunlight is blocked or absorbed by clouds in the atmosphere. Solcast calculates this for live data using satellite imagery and comparing to recent surface reflectance (albedo) data. Providing historical, live and forecast irradiance data for the solar industry means that we track where every cloud is, has been and is going, plus how thick they are. Calculating the thickness allows us to model how much direct, and diffuse (i.e. scattered) irradiance will make it to the solar panels at ground level.
For live and historical data, we calculate cloud opacity as 'actuals', and for forecasts we also provide 'probabilistic scenarios' or P10 and P90 data along with a deterministic forecast. Whilst cloud opacity is useful for predicting whether you will be able to see the eclipse, in solar applications it's mostly used as an input into diffuse separation models to calculate GHI, DNI, DHI.
How will the eclipse affect the Grid?
Whilst the impact of this eclipse is significant, it is predictable, and grid operators have prepared and planned for the impacts. Large storm events, snow dump events and large heavy cloud fronts are less spectacular but can have even bigger impacts on whole day solar generation. These events are also harder to plan for and predict, which makes it more important for asset owners and grid operators to use forecasts to plan and manage the impact of weather on solar generation as solar increases in the generation mix.
As of the 4th of April, it looks like ERCOT may have a cloudy day, limiting the ramp rate impacts of the eclipse, whilst ISO-NE looks in for a sunny day, meaning the impact of rooftop solar coming on and offline will be seen in their demand curve.
How do I track the impact on my solar projects?
You can access Solcast actuals and forecast data for evaluation purposes instantly and for free by creating a Commercial Toolkit account. With your API key from your account you can use the Solcast SDK, or integrations with pvlib and PVSyst to pull Solcast data into your existing generation models.


.avif)


