


Typical Meteorological Year
Download a statistically representative “typical year” file built from 15 + years of satellite data for long-term yield modelling.
IRRADIANCE , WIND AND WEATHER DATA
Power Forecasting Models
Insights
Validations
IRRADIANCE AND WEATHER DATA
Historical Time Series
Typical Meteorological Year
Live Data
Forecast Data
POWER FORECASTING MODELS
DNV GREEN DATA PRODUCTS
PV and Wind modelling methodology built on decades of DNV expertise
.avif)
Solcast offers advanced premium wind and PV modelling for complex grid scale or portfolio operations. Premium models include support from DNV data scientists and training or tuning based on measurements, so are built for operational power forecasting and analysis. Where high quality, live measurements are available, particularly for wind models, our Premium Power models are able to train a power model based on recent generation to forecast very near term generation for dispatch planning and bidding. For less reliable measurement data, our team of data scientists can tune a power model based on your available history, including cleaning the data where necessary, to create and keep updated a tuned power model based on real conditions.
Premium models convert raw meteorological intelligence into site‑specific power, load, and weather forecasts through a layered physics‑plus‑statistics engine.
At the highest level the workflow is:
The sections below unpack each stage for engineering audiences.
Premium Power models can rely on Solcast nowcasting, and ingest one of the industry’s largest multi‑model ensembles (GFS 1°/0.25°, NAM 12 km/3 km, HRRR, RAP, CMC 10 km, ECMWF, UK Met, Meteo France, etc.), retrieving GHI, temperature, pressure, humidity, wind, cloud cover/type and more. The breadth ensures robustness and lets the system exploit complementary model strengths.
Raw grids are down‑scaled (<10 km) with terrain‑aware physics and a toolkit of statistical correctors:
Technique | Input Signals | Purpose | |
|---|---|---|---|
Model‑Output Statistics (MOS) | Company focus | NWP irradiance, solar geometry | Remove systematic diurnal & irradiance‑dependent bias |
ARMA Time‑Series | Past forecast errors | Capture short‑lived autocorrelation | |
Artificial Neural Network (ANN) | 1 yr SCADA + NWP | Non‑linear bias correction leveraging multi‑layer feed‑forward network | |
Analog Ensemble (AnEn) | Historical NWP + obs | Pattern‑matched analogue days for minutes‑to‑days horizons |
Each refined NWP member is weighted with a least‑squares / genetic‑algorithm optimiser so that de‑correlated errors cancel, reducing MAE across all horizons (“cancellation effect”).
Refined meteorology is passed to a deterministic PV performance kernel:
Symbol / Step | Description |
|---|---|
DIRINT | Splits GHI into beam + diffuse |
POA | Plane‑of‑Array irradiance by tracker geometry |
PDC=POA⋅(1−α)⋅γ⋅AP_{DC}=POA·(1-α)·γ·APDC=POA⋅(1−α)⋅γ⋅A | DC power with temperature derate |
PAC=β(PDC/Cap)⋅PDCP_{AC}=β(P_{DC}/Cap)· | Inverter efficiency curve |
ML stacking (optional) | The proportion of the site's ground area covered by modules. |
Module type | Multi‑regressor ensemble for residual error |
Accuracy is typically within ±1.5 % of measured power given a perfect POA forecast.
Real‑time SCADA is harvested via secure APIs to auto‑update bias terms, probabilistic spreads and short‑term learning models. Scheduled or unscheduled derates, icing and high‑wind cut‑outs are injected so forecasts honour true availability. Where real time SCADA data is unavailable, we can tune a power model based on historical production data, and clean that data if required.
Component | Description |
|---|---|
Turbine power curve | IEC-compliant curve corrected for air-density and turbulence intensity. |
Availability & curtailment | Real-time SCADA (turbine status, derates) injected so forecasts reflect true operability. |
High-wind cut-out / restart | Cut-out, cut-in and hysteresis logic applied using manufacturer limits to avoid overprediction in storm conditions. |
Expected accuracy. For a typical utility-scale wind farm with ≤2 h SCADA latency, the model achieves a day-ahead Mean Absolute Error of ~8–12 % of capacity; short-horizon errors drop below 5 % under feedback conditions.
Premium power models merge four complementary approaches—Analog Ensemble, ANN, supervised Self‑Organising Maps and stacking ML—to relate regional weather, calendar effects and socio‑economic drivers to demand. The framework is tuned hourly and supports horizons from 5 min to 7 days.
For pure meteorological variables the same bias‑correction and optimal‑blend pipeline combines >10 global and regional models, delivering location‑specific forecasts with hourly resolution to 7 days (extendable to 14 days).
Method | Best‑fit Horizon | Output |
|---|---|---|
Statistical residual analysis | All | P‑levels (P10–P90) |
Analog Ensemble spread | 5 min – 3 d | Flow‑dependent probabilistic bounds |
ML quantile regressors | 15 min – 7 d | Rapid uncertainty re‑calculation from historical error |
NWP ensemble spread | 6 h – 7 d | Range of plausible trajectories |
Ramp‑event uncertainty | Event‑centred | Timing & magnitude envelopes |

Download a statistically representative “typical year” file built from 15 + years of satellite data for long-term yield modelling.
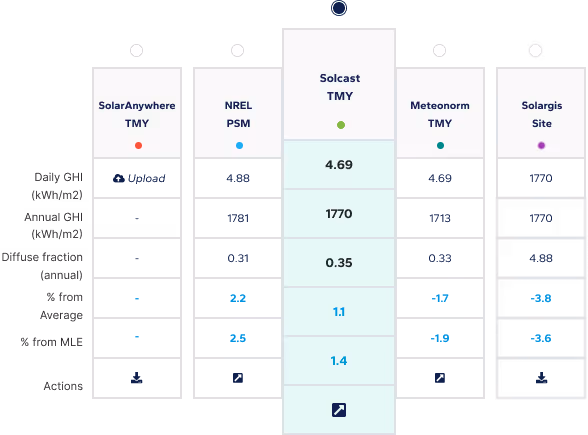
Compare multiple satellite data sets side-by-side to choose the most bankable resource file for your site.
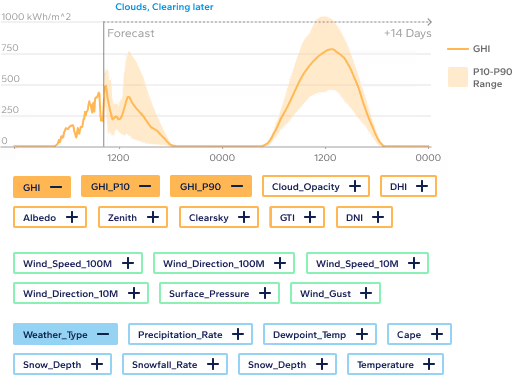
Access industry-leading solar forecasts up to 14 days ahead, combining satellite nowcasting and weather models for precision energy planning.
Subscribe to our newsletter to keep up to date with all the latest news.
Subscribe to our newsletter to keep up to date with all the latest news.