


Dr. Hugh Cutcher
April 23, 2025
Share this post
The European State of the Climate 2024 report, jointly produced by Copernicus Climate Change (C3S) and World Meteorological Center using ECMWF data, has confirmed a year of extremes, with 2024 officially declared the warmest year on record for the continent. Among its findings is a detailed assessment of solar conditions across Europe— including sunshine duration anomalies that highlight a long term positive irradiance trend as the climate changes, and a 2024 marked by an east/west divide in solar radiation.
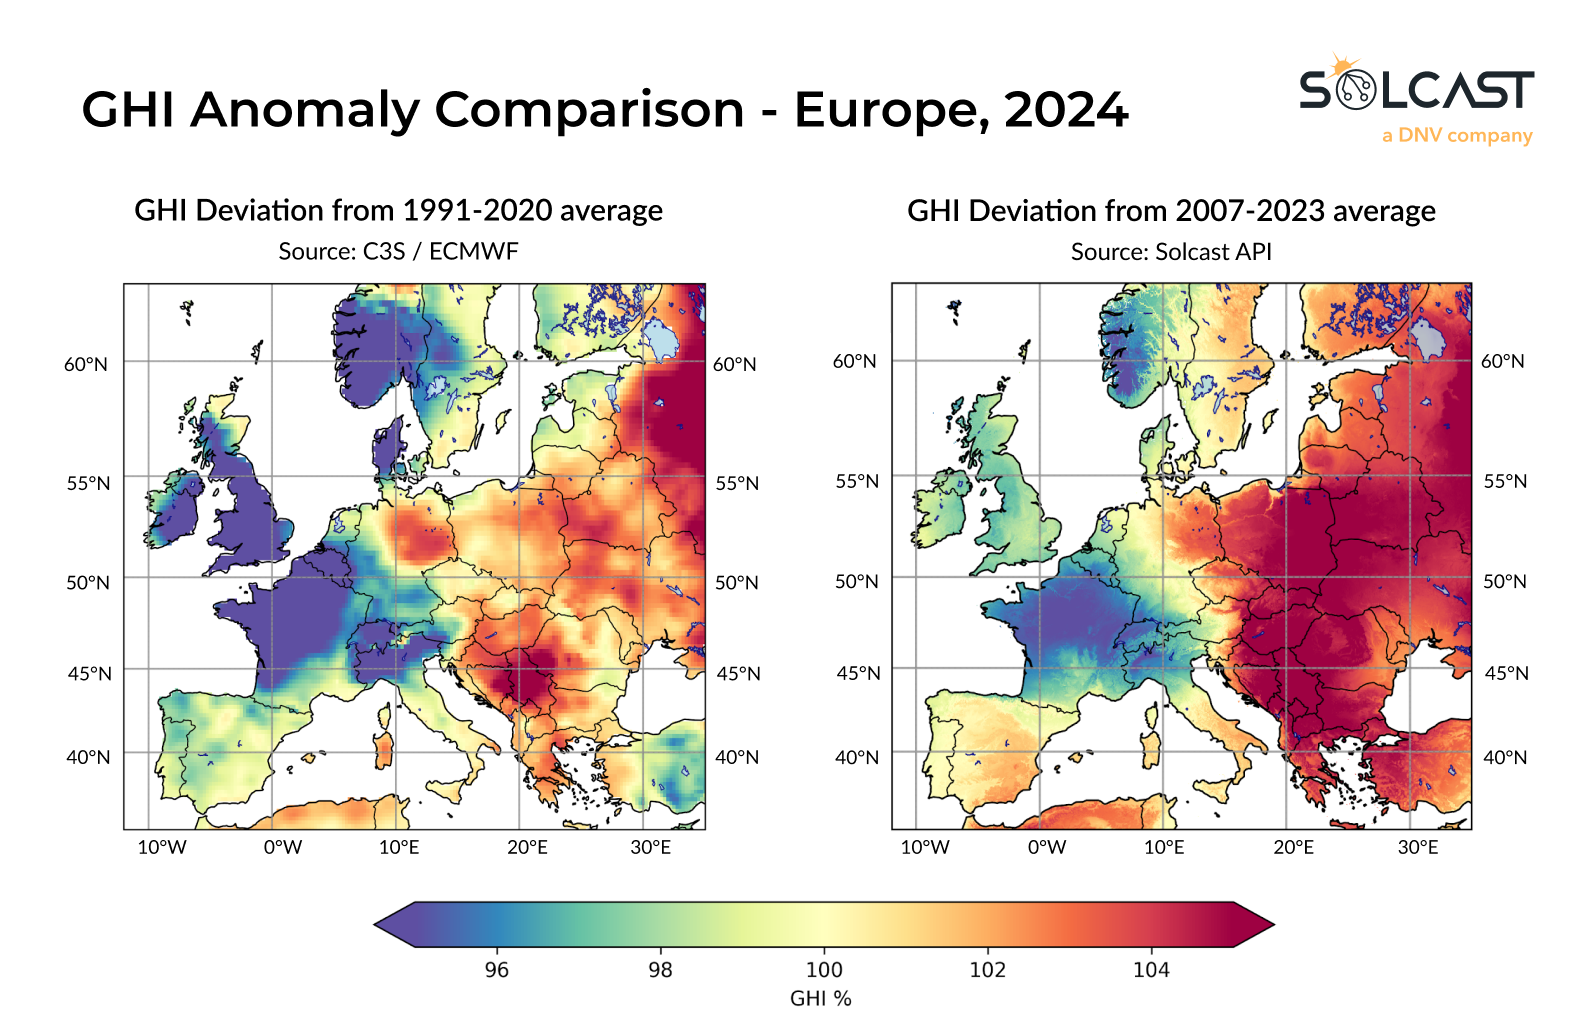
These findings align with 2024 solar analysis using the Solcast API published in January, which revealed a similar east/west divide in solar irradiance anomaly across the continent during 2024. Despite methodological differences, both analyses point to a similar geographic distribution of solar anomalies — reinforcing the broader climate signal observed throughout the year.
The difference in anomaly magnitude between the two datasets primarily stems from the long term (climatology) periods used. The WMO’s analysis is based on a 1991–2020 baseline, while Solcast's uses a more recent 2007–2023 period that relies on modern high-resolution satellite imagery. Because of the positive trend in solar irradiance over time, using a more recent climatology results in a slightly different anomaly — not because the data disagrees, but because today’s “normal” is rapidly shifting. Older baselines include decades of cooler conditions, which lowers the average and changes the perceived anomaly.
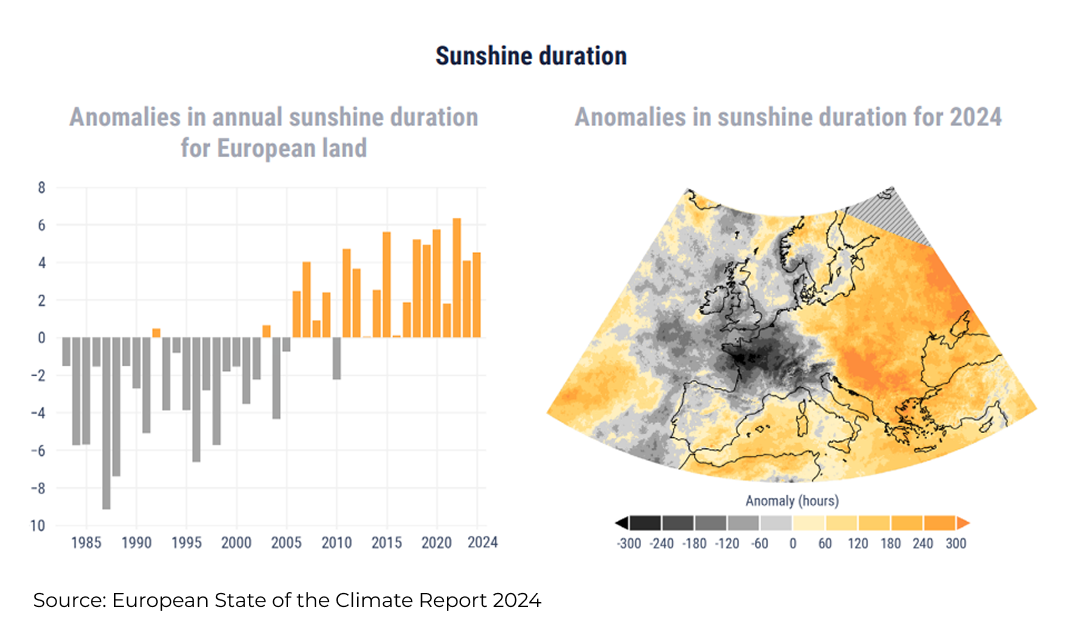
Whilst not the same measure as the above anomalies, the below ‘sunshine duration’ map from the same WMO report, clearly demonstrates the impacts a changing climate can have on solar resource availability.
This difference highlights an important consideration for solar operators and energy planners. Long-term records remain valuable for tracking climate change, but when modelling solar performance data needs to reflect current conditions. Long term averages are a useful tool in resource assessment and design, but analysts need to be aware of the effects of climatic trends. The consistency between ECMWF and Solcast findings, despite methodological differences, reinforces the need for up-to-date datasets that capture the most recent trends.
With solar performance increasingly influenced by evolving climate signals, access to accurate, timely data is becoming critical. As 2024 shows, assumptions based on outdated baselines risk misrepresenting current realities. Looking forward, solar planning must be grounded in data that reflects where we are now and going — not where we were thirty years ago.
Track weather conditions, cloud movements, and irradiance-influencing factors that impact your solar generation. Access bankable actuals and accurate forecasts when you sign up for a Solcast API toolkit. You can reach out to our team for an extended trial.