Use cases for solar forecasting technology in electricity networks
Recently, our CTO Dr. Nick Engerer, participated in a webinar with the Texas Renewable Energy Industry Alliance (TREIA). In this webinar, one of the topics discussed was the usage of solar forecasting technologies by electricity networks. In the short 4-minute video below, you can hear the key points:
Solar forecasting is important for electricity demand prediction
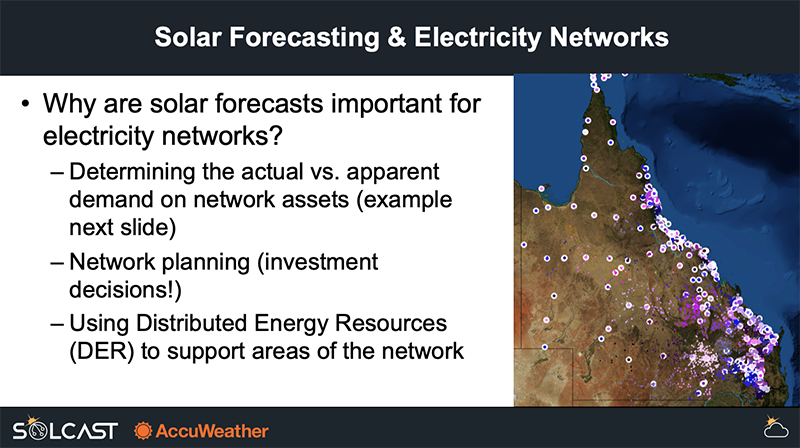
The first major use of solar forecasts by distribution networks (low voltage network operators) is for the daily prediction of actual (gross) demand on a given network asset. Here we provide an example from Essential Energy in New South Wales, Australia.
A few facts about Essential Energy:
- 737,000 km2 service territory (one of the world’s largest)
- The network services around 850,000 customers; many on remote Single Wire Earth Return (SWER) connections
- The installed capacity of small-scale solar PV installations is more than 575MW, which is approximately 25 per cent of the network wide peak demand of 2.3GW.
Behind the meter solar PV challenges for distribution networks
One of the challenges facing Essential Energy, and many other distribution/low-voltage network operators around the world, is that increasing levels of 'behind the meter' solar PV are changing the apparent (net) load on the network. For a distribution company, this is usually first visible at zone substations which have >10% solar PV penetration (installed capacity to peak demand).
In the below example, we can see on the left, how this causes the apparent (net) demand at zone substation level become rather unpredictable on a day to day basis. This was certainly not the cases before rooftop PV became popular, when daily demand was very predictable and driven mostly by temperatures.
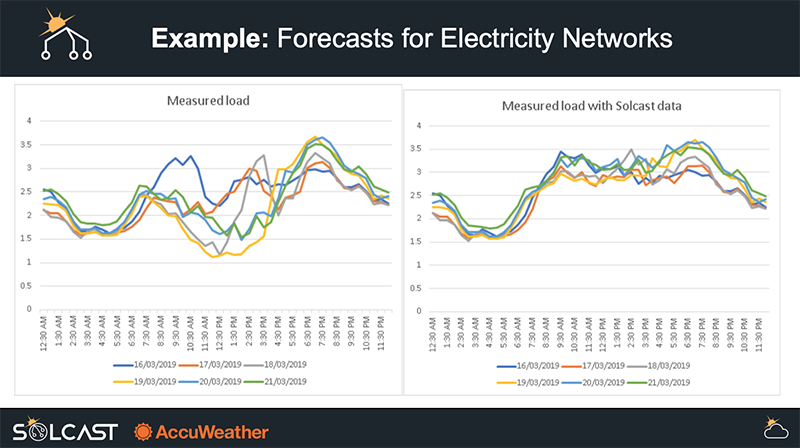
Solar forecasting technologies for gross load profiles
Through creation of customised Solcast Grid Aggregations for the behind the meter solar installed downstream of a particular zone substation, Essential Energy was finally able to correct the apparent (net) demand profiles for the impacts of cloud cover (tracked by our rapid update solar forecasting system). At right, are the true 'gross' demand profiles after correcting for the day to day variation of solar generation. These are once again the more predictable versions of demand that distribution network operators are used to working with!

Dr. Nick Engerer
Nick is an expert in the field of solar radiation and distributed solar PV modelling, and has co-founded Solcast out of a sincere desire to enable others to build the solar-powered future.